
City Tech and Partners Use NASA Environmental Data to Evaluate Urban Heat Interventions
Increasing Temperatures Bring Increasing Threats
In the
face of climate change and extreme temperature events, urban planners and
municipal officials must have access to better data and analytics to assess and
respond to urban heat risks.
City
structures absorb and hold on to heat longer, raising urban temperatures and
making them difficult to cool. These urban heat islands
– where
buildings, concrete, and other development are significantly warmer than
surrounding areas – pose immediate and long-term threats to human health and
city infrastructure. High temperatures increase our demand for air conditioning
and coolants, which in turn produces more greenhouse gases and air pollutants. Sudden
heat events and the corresponding increased peak energy demand can lead to power outages. In addition
to causing widespread discomfort, heat can worsen respiratory difficulties, inflict
heat cramps and exhaustion, and contribute to heat-related deaths.
These risks
are of greatest concern for vulnerable populations, including young children,
the elderly, and people with underlying health conditions. Chicago’s
1995 heat wave killed more than 700 poor and elderly residents, and in Europe – where less than five percent of homes are equipped with air conditioning and
cool air on public transit is a rarity – a 2003 heat wave was blamed for 15,000
deaths in France alone.
In addition
to human risks, heat puts additional strain on city roads, buildings, and other
physical structures, causing them to age faster and driving increased
maintenance and repair costs. Recent
examples of melted roads, buckled rails, and overstressed bridges test
residents’ patience, challenge municipal budgets, and disrupt urban life. Many
cities have implemented urban design changes, such as green
spaces and reflective surfaces, to mitigate heat threats and cool buildings
and the surrounding areas.
To-date, many
assessments of urban heat mitigation efforts have anecdotal, at best. Most cities lack data to evaluate specific interventions
and to inform future investments. With the right tools, public planners,
property owners, and other urban stakeholders could better understand which interventions
would be the most impactful at specific locations.
Collaborative Solution Development to Mitigate Urban Heat
Collaborative
solutions are critical to combining the best tools, technologies, and methods to
address complex problems.
To address the
growing threat of urban heat, City Tech Collaborative
partnered with Microsoft, Esri, d3i
Systems, and the City of Chicago to quantify
cities’ heat reduction efforts.
The
partnership combined unique technical expertise to build a new tool to inform
local and regional urban heat planning efforts, with the goal of equipping
urban planners and other stakeholders to deal with shocks and long-term
stressors associated with extreme heat events.
By aligning shared goals and incentives, this project drove rapid
integration and testing of industry-leading capabilities:
- Microsoft Azure and other tools were critical for the management, security, and analyzation of climate data;
- More than 20,000 global cities use Esri’s ArcGIS mapping and spatial analytics software, which provided an essential platform to host urban heat island assessment data;
- d3i Systems’ expertise in supercomputer-based research using advanced models of Earth’s atmosphere, oceans, and land masses helped the team understand heat trends and the effect on the Earth’s surface;
- The Chicago Department of Planning and Development brought critical stakeholder feedback on solution design and usefulness; and
- City Tech convened, structured, and accelerated the collaboration on a new solution that would not have been possible for any single participant to have created alone.

Urban Heat Response: Project Design and Findings
City Tech
and partners began the work with a simple question: do urban heat interventions
such as parks and green spaces measurably reduce the surrounding areas’
temperature?
To answer
this question, the team used existing NASA
(National Aeronautics and
Space Administration) Landsat data to analyze local heat trends and measure temperature
changes over time. By focusing on specific locations where planners had
installed heat-reducing green infrastructure, the team could evaluate the
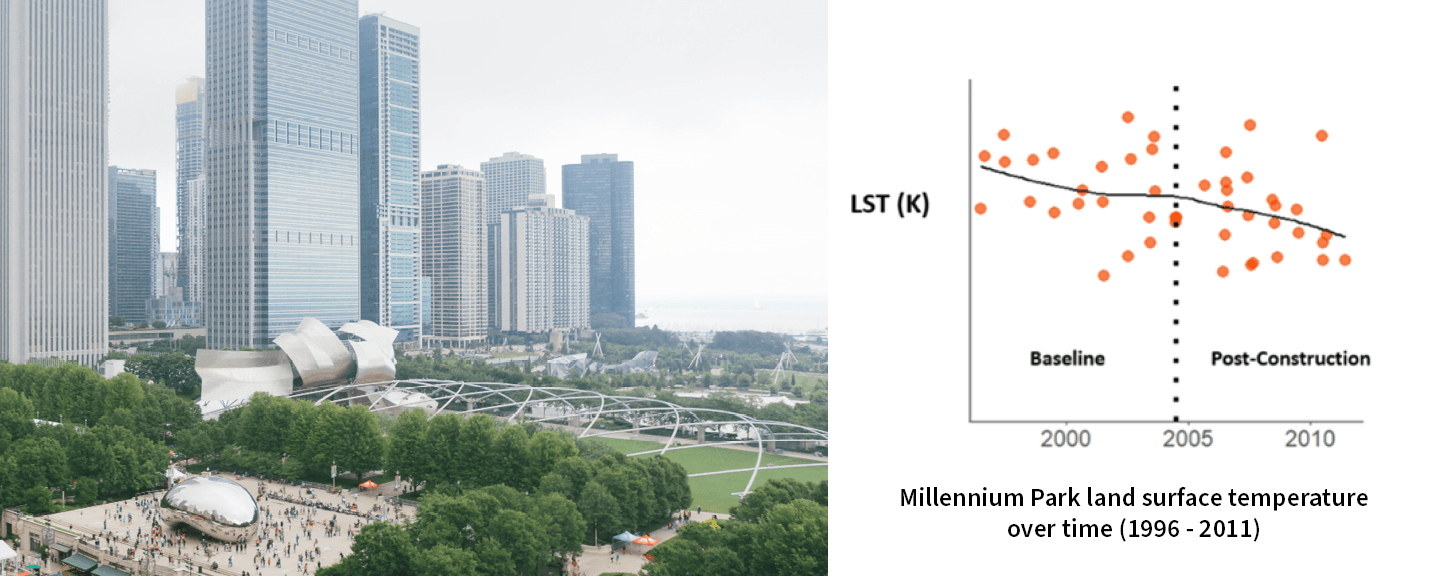
impact of these interventions. Using
Chicago as a testbed for the new tool, solution participants assessed 26 parks
and green spaces built since 1988. Five
of these sites showed a statistically significant decrease in temperature of
the surrounding area. One site experienced a statistically significant increase
in temperature, and the remaining 20 sites were determined to have negligible
change in temperature.
Although
many factors – including new green infrastructure – contribute to ambient
temperature, the team proved that it was possible to quantify temperature
changes at specific locations over time. In analyzing NASA’s Landsat images,
the
team controlled for cloud cover and image quality; future tests could include
additional control sites to understand the impact of material properties,
vegetation density, and the intervention site’s surrounding environment.
This type
of analysis demonstrates great promise for a commercially-viable urban heat island
assessment tool. Equipped with this data for the first time, urban planners and
municipal officials can understand whether or not the interventions are meeting
their objectives, the significance of the interventions’ effects, and what
types of interventions may be best-suited to a particular location.
For
details on the Chicago case study, please see below.
Next Steps
Each
successive heat wave reaffirms the need for cities to take action to address
the rising threat of urban heat. City Tech, Microsoft, Esri, d3i
Systems, and the City of Chicago
successfully created a replicable, scalable study of urban heat spots over time
and assessment of site-specific heat interventions. Using these findings, urban
planners can focus their efforts on areas that are most vulnerable to shocks
and long-term stressors associated with extreme heat events as well as
understand which interventions achieved their goals of mitigating extreme heat.
This new data is essential to inform how cities plan and implement future green
spaces, cooling shelters, utility-sponsored programs for low-income customers,
public health interventions, and weather-related emergency response to ensure
that resources get to the communities and populations that need them most.
This
collaboration highlights the opportunity to integrate this methodology into a commercially
available visualization and planning tool accessible to municipal governments
and other stakeholders. Although the COVID-19 pandemic has delayed efforts to
integrate urban heat island assessment into the ArcGIS mapping and analytics
platform for the time being, project participants are determined to expand
access to this important capability in the near future.
For more
information on City Tech’s Urban Heat Response Solution, please visit https://www.citytech.org/urban-heat-response.
Case Study: Chicago Heat Trends and Interventions
The Urban Heat Response project used Chicago’s heat trends and interventions as a case study. Using imagery for summer months (i.e. June, July, and August) from NASA’s Landsat 5, 7, and 8, the team identified changes in macro- and micro-level hotspots from the 1980s to present and measured the statistical significance in temperature changes associated with locations where interventions – such as green roofs and parks – were implemented.
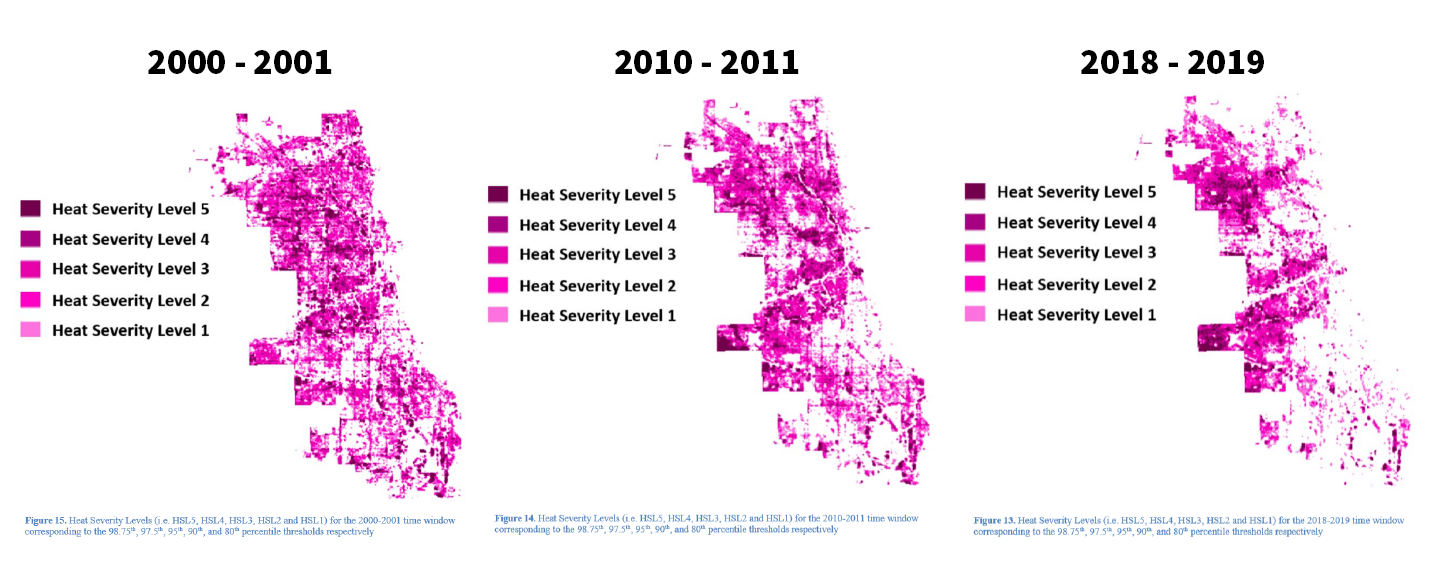
Overall findings of Chicago’s heat trends include:
- Macro-level hot spots have decreased most drastically on the south side Chicago and near the lakefront, with lesser reductions in the center of the city and on the far north side.
- Hot spots have persisted (and some have intensified) on the far northwest, west, and southwest sides of Chicago.
- The most significant microlevel hot spots are clustered in the far northwest side and southwest, particularly near Midway Airport.
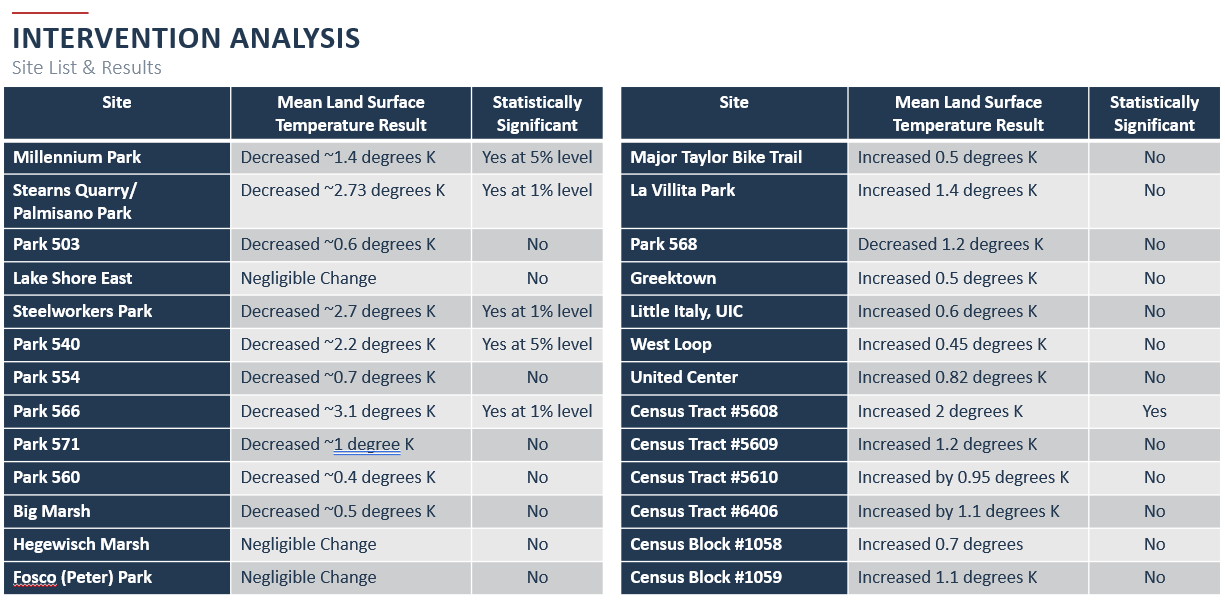
The team analyzed a total of 26 intervention sites, neighborhoods, and census tracts as part of the study. Five locations showed a statistically significant decrease in land surface temperature:
- Millennium Park
- Stearns Quarry/Palmisano Park
- Steelworkers Park
- Park 540
- Park 566

One location, Census Tract #5608, showed a statistically significant increase in temperature.
About City Tech Collaborative (City Tech): City Tech is an urban solutions accelerator that tackles problems too big for any single sector or organization to solve alone. City Tech’s work uses IoT sensing networks, advanced analytics, and urban design to create scalable, market ready solutions. Current initiatives address advanced mobility, healthy cities, connected construction, and emerging growth opportunities. City Tech was born and raised in Chicago, and every city is a potential partner. Visit www.CityTech.org and follow us on Twitter and LinkedIn.