
Interactive Tools to Help Understand Complex Processes: Chicago Health Atlas and the Opioid Epidemic
The advancement of web technology in recent years has resulted in the development of a number of powerful tools to help understand complex, interrelated phenomena. These tools can be effective in showing the interaction of social and environmental factors with health outcomes.
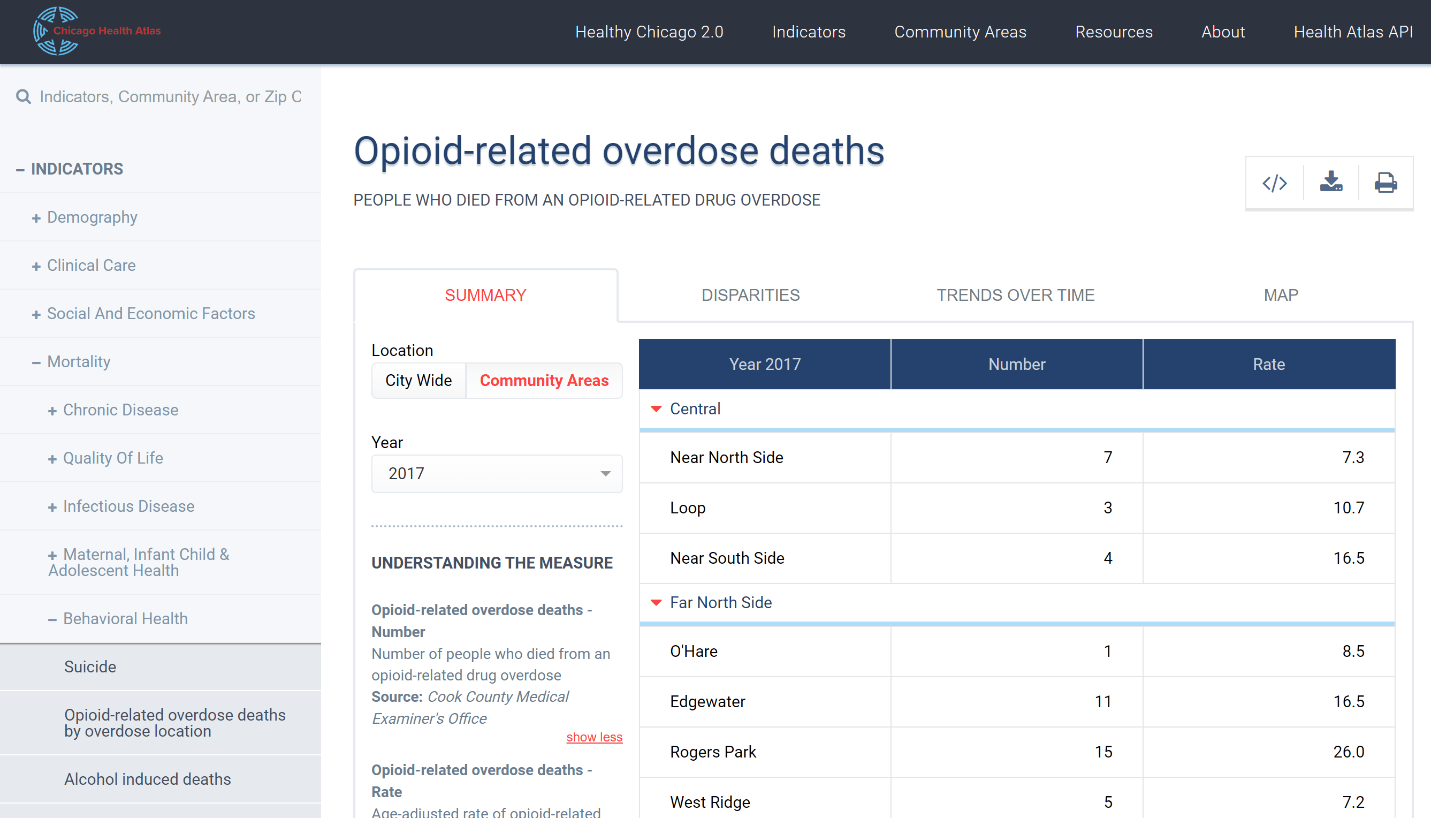
The Chicago Health Atlas is one such tool. The Atlas, initially developed in 2012 by the Smart Chicago Collaborative and the Chicago Department of Public Health (CDPH) with funding from the Otho S.A. Sprague Memorial Institute still stands as the city of Chicago’s repository for neighborhood level health data as part of the Healthy Chicago 2.0 plan . The Atlas allows Chicago residents and public health stakeholders to easily search, analyze and download health data for the city of Chicago.
With data from more than 30 sources, users can explore the health outcomes, behaviors and characteristics of their neighborhoods and the entire city of Chicago. The Chicago Health Atlas includes street-level maps of resources (grocery stores, schools, clinics, housing services, etc.) for 55 community areas. Data contained in the Chicago Health Atlas can be downloaded and all charts, maps and tables can be printed for use in grant applications, community meetings, student presentations or Nobel prize speeches.
With the updated Atlas, users can:
- Explore data for more than 160 measures of health
- View a profile of your community’s health and compare to the city overall
- Display graphs of health disparities and trends over time
- Print and download data summaries
- Map a wide variety of community resources across 55 community areas
- Get data directly from the Atlas to create new apps, tools and visualizations through an open application programming interface (API)
The Atlas includes information from the Healthy Chicago Survey, Illinois Department of Public Health vital statistics, cancer registry and hospital discharge data, Chicago Public Schools health records, CDPH health surveillance systems, Chicago Police Department crime data, Chicago Department of Transportation crash data, census data and resources from MAPSCorps as shown below.
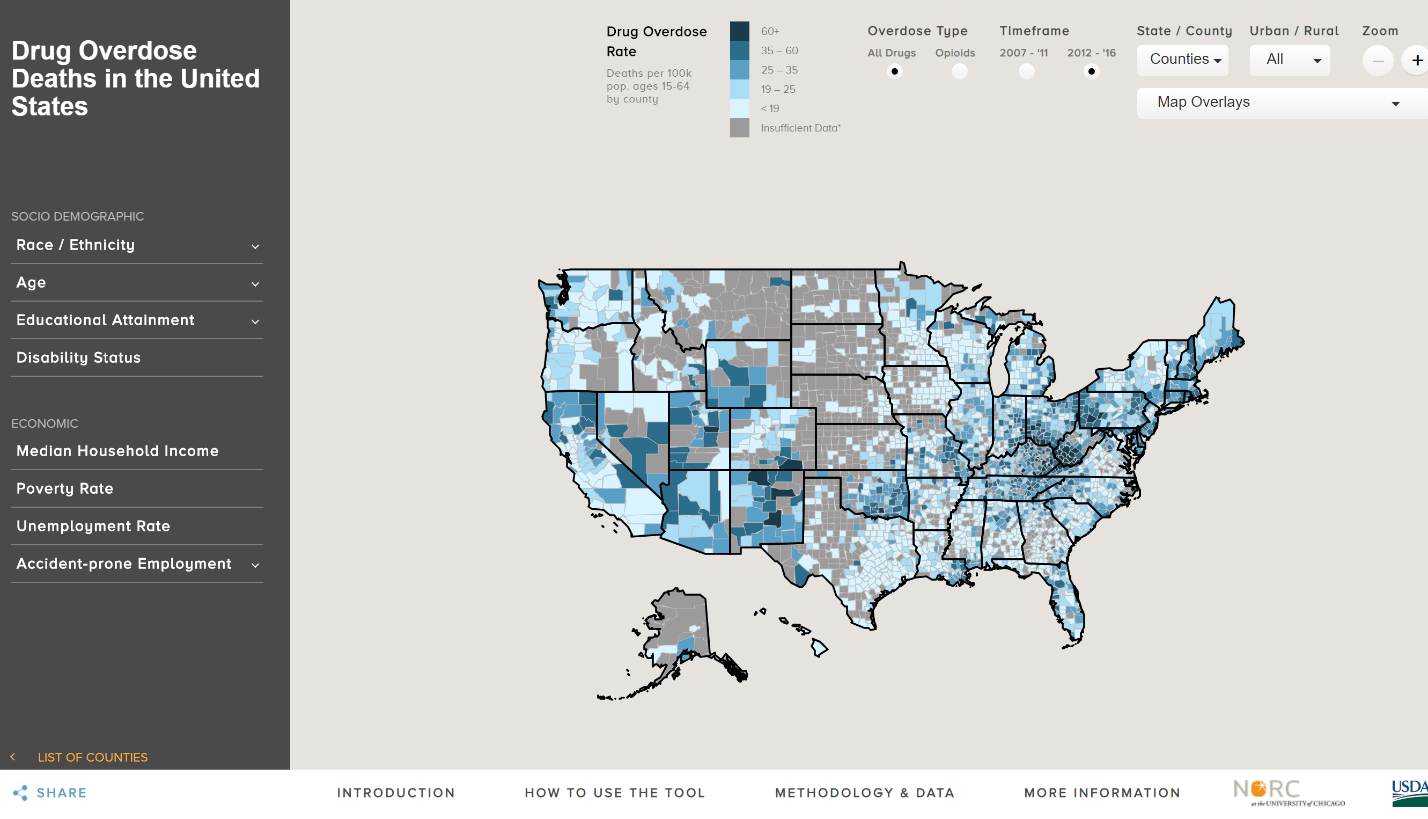
NORC at the University of Chicago has embarked on a similar strategy of developing tools and resources to help understand the opioid epidemic in relation to the larger social-environment, first with a focus on counties within the Appalachian region, later expanded to all counties in the nation. Both tools were created in JavaScript using the Leaflet web mapping library. The tools reveal county-level overdose mortality data and overlays of socio-economic factors, including poverty, unemployment, educational attainment, and disability, among others. They not only allow the user to research how social factors are spatially associated with overdose death in the United States, but also how a specific county compares with its state and the nation as a whole. Users of the Opioid Misuse Community Assessment Tool can digitally zoom in and display data for each of the 3,142 counties in the United States. Users can compare county-level information regionally and nationally and create printable/e-mailable fact sheets to support community planning and response efforts.
While the NORC tools function well for
smaller population counties, we recognize that county level data is of limited
utility in larger metropolitan counties. Looking ahead, NORC at the
University of Chicago and the City Tech Collaborative teams intend to
collaborate on tool functions that allow users in these counties to access and
explore data at the sub-county or community level, taking advantage of the data
and technology capabilities of both organizations to develop new tools and
resources that allow for a more detailed analysis of Chicago data.
About City Tech Collaborative (City Tech): City Tech reinvents cities. With partners and people, we remake essential services and infrastructure, from skills to skyscrapers. We then prepare these solutions for other cities, thus increasing the world’s odds of solving big, urban problems. We are currently easing subway congestion during large events; creating a digital map of Chicago’s underground; and launching a digital directory of public health services in Chicago.To learn more, follow City Tech on Twitter or join our LinkedIN group.
About NORC : NORC at the University of Chicago is an objective, non-partisan research institution that delivers reliable data and rigorous analysis to guide critical programmatic, business, and policy decisions. NORC conducts research in five main areas: Economics, Markets, and the Workforce; Education, Training, and Learning; Global Development; Health and Well-Being; and Society, Media, and Public Affairs. @NORCnews