
City Tech Collaborative targets 2020 for putting heat mapping tool in urban planners' hands
Dive Brief:
- City Tech Collaborative is working on a tool that will make urban heat data more accessible to planners, specifically in Chicago where the prototype is slated for testing in early 2020.
- Urban planners, emergency management directors and local policymakers can use the data to "identify urban hotspots and quantify the impact of urban heat interventions or land use policy changes," Jamie Ponce, director of strategic partnerships at City Tech Collaborative, told Smart Cities Dive.
- The partners, Microsoft, Esri, systems engineering and advanced analytics firm d3i Systems and the City of Chicago will continue their work to devise the tool through the end of this year. The tool will integrate NASA weather and climate data into Esri's ArcGIS mapping and analytics platform.
Dive Insight:
Cities are known to be warmer than surrounding rural areas because of human activities.
The amount differs according to each city's conditions — including density, vehicular activity, weather and climate — but the variance can be as much as 10 degrees.
The infrastructure surfaces traditionally used in cities inherently make them prone to absorbing and holding heat. Dark asphalt, dark roofs, glass and a lack of green space contribute to the problem. More cities are tackling the issue by encouraging or mandating that developers incorporate light-colored or reflective surfaces as well as green roofs into building projects.
Last year, Denver revised its green roof law
that required rooftop greenery to instead push for light-colored, reflective "cool roofs."
Last month, New York City doubled the size
of its green infrastructure program. And last year, Washington, DC earned top honors
from Green Roofs for Healthy Cities for having the most square footage of green roof installations in North America in 2017.
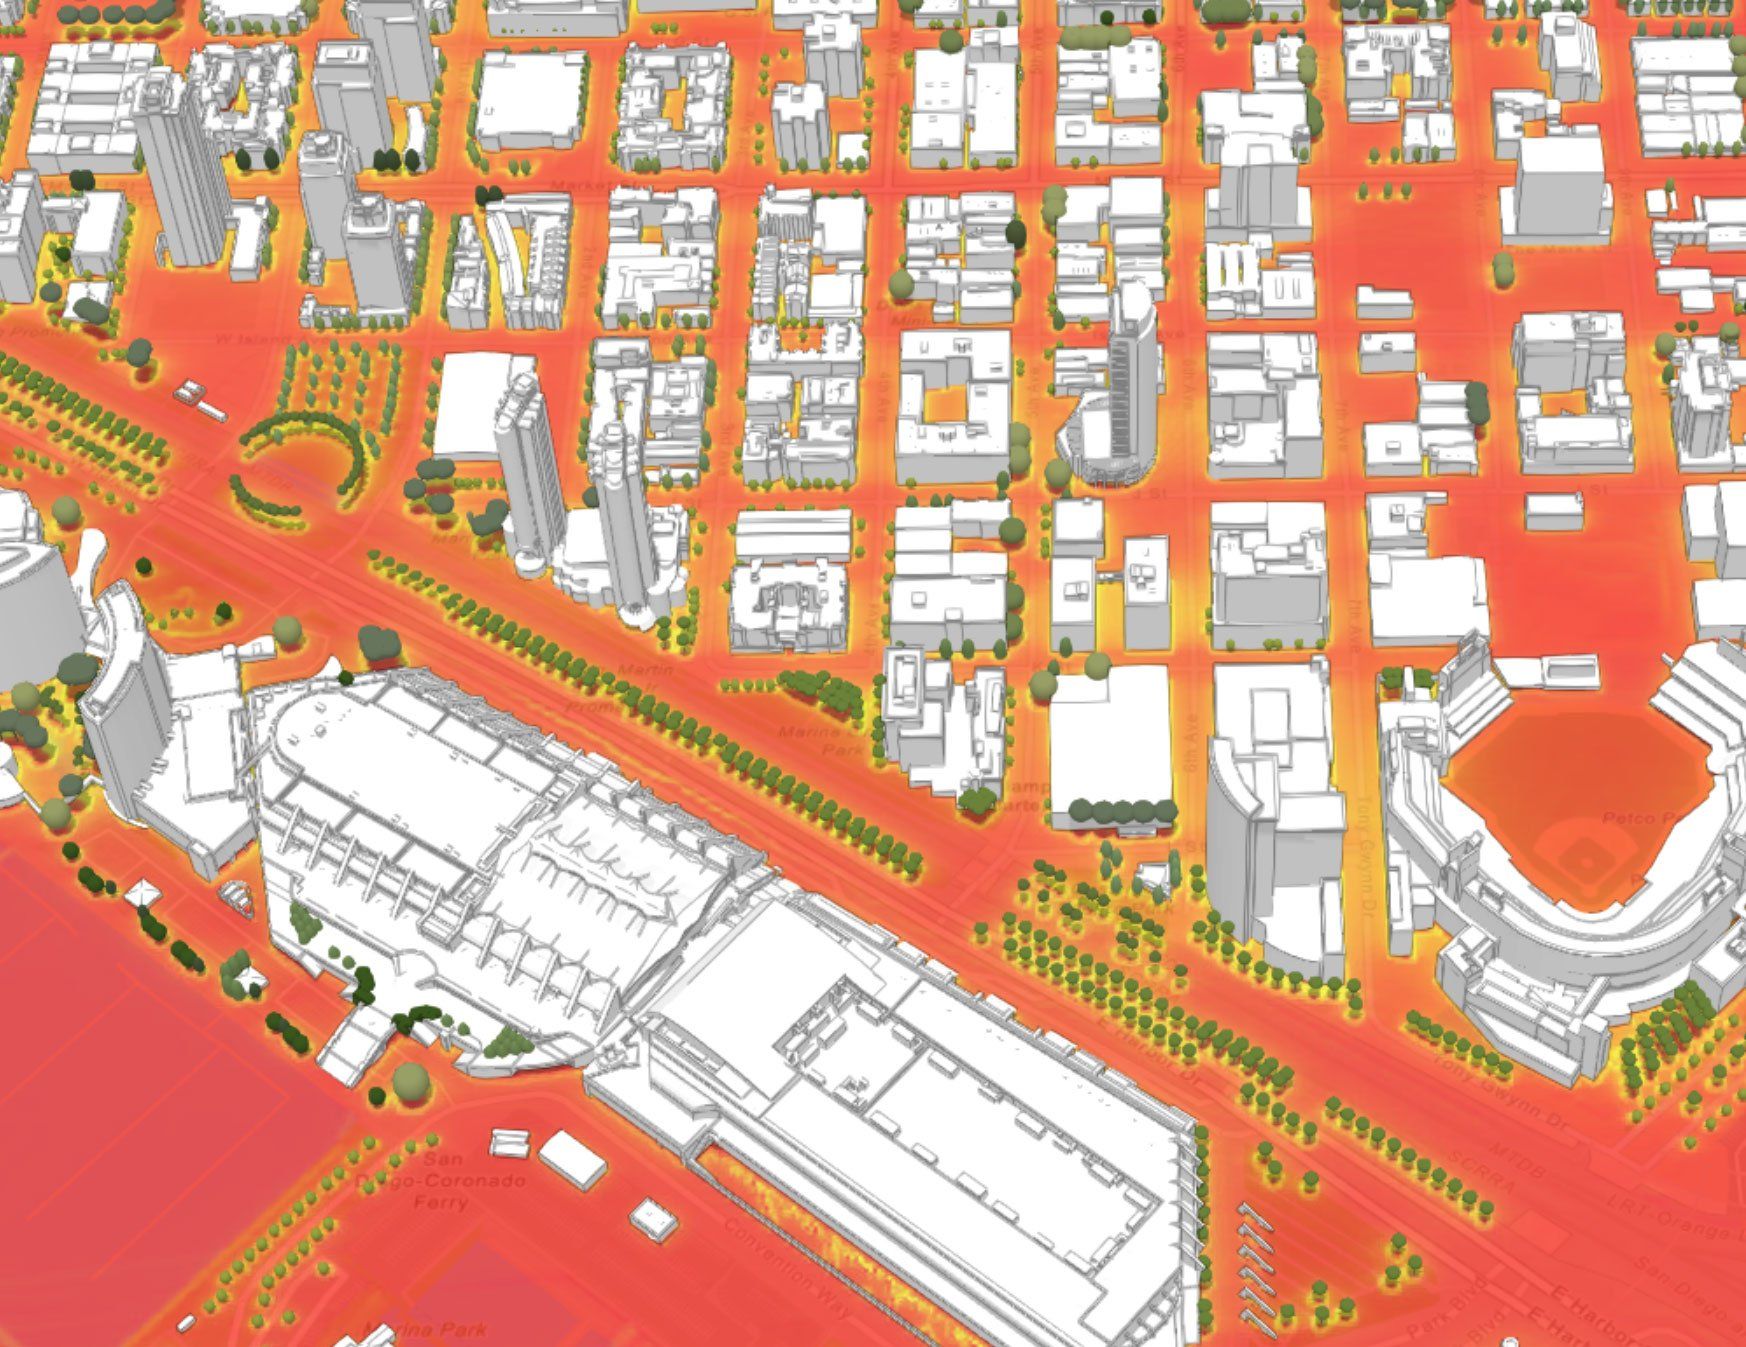
City Tech Collaborative's heat mapping tool will allow urban planners to understand the areas in a community most susceptible to the heat island effect and track the changes over time. It will provide more granular information than has been available on this topic.
"Part of the challenge of urban heat islands is that they are hyper local," Ponce said. "We are bringing together new data and insights and capabilities to help urban planners deal with the urban heat island effect in a way that has been stymied by a lack of data and a lack of hyper local information."
The urban heat visualizations will be based on NASA satellite images that show heat concentrations and change over time. The satellites pass over a city two to three times per month, which would provide approximately six images per summer that could be used to update the mapping tool.
Better community evaluations will allow planners to match solutions of best fit with high-heat areas. The mapping tool could help planners determine if roofs in a certain area might benefit from installing reflective surfaces or if a high-heat area is a prime target for a green space.
Low-income and underserved communities tend to be the most at risk to the heat island effect and climate change. They house the least green spaces, dark surfaces are prevalent and they often are the most polluted. Children, older citizens and those with health conditions are especially susceptible to negative health effects from high temperatures. City Tech Collaborative says it aims to help these populations first.
Once the heat mapping tool is live, it should be accessible to cities of all sizes because it will build on Esri software many urban planners already use. Following the proof-of-concept period, the tool could be expanded to include any city for which satellite data is available.
"The beauty of this solution is that we would be increasing the usefulness of GIS mapping tools that most cities already are using," Ponce said. "This effort would expand the reach, capacity and usefulness of the existing tools."
Read the article at Smart Cities Dive.