
Data and tools for climate-change management
To give city planners better access to data and analytics related to urban heat risk, a public-private partnership plans a tool that incorporates environmental data for urban design and infrastructure planning.
Chicago's City Tech Collaborative, a nonprofit dedicated to tech-based innovation, is partnering with Esri, Microsoft, d3i Systems and the City of Chicago on a new tool to give local and regional officials actionable information on urban heat trends, with the goal of helping cities improve heat resilience and inform heat-related management decisions.
The tool, which will be hosted in the Microsoft’s Azure Cloud, will use Esri's ArcGIS mapping and analytics platform to display NASA's weather and climate information. Users will see the impact of past interventions such as tree planting and can access data for planning future green spaces, cooling shelters, utility-sponsored assistance for low-income customers, public health interventions and weather-related emergency response.
The tool will be scalable to other applications and other cities, the City Tech Collaborative said.
It's as hot as...
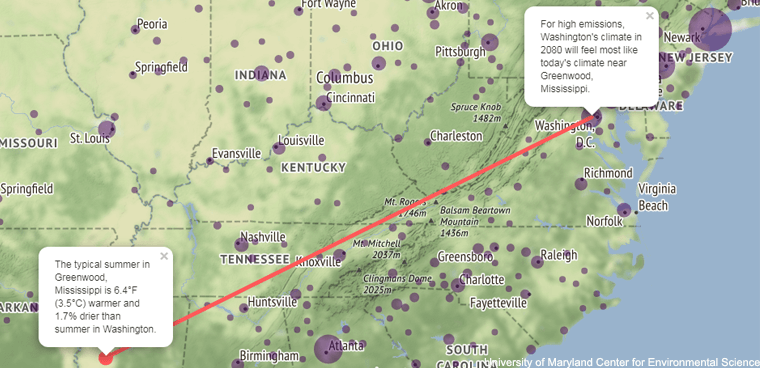
An interactive web visualization tool developed by researchers Matthew C. Fitzpatrick and Robert R. Dunn uses climate-analog mapping to illustrate what effects 60 years of greenhouse gas emissions will have on a location’s climate. It translates a city's future climate forecasts to another city’s current weather to illustrate how the change may impact people's lives of people. If, for example, emissions don’t change by 2080, Washington, D.C., will feel like today's Greenwood Miss., where the typical summer is 6.4 degrees higher and 1.7% drier.
The researchers used 12 different climate measures, including minimum and maximum temperature and total precipitation across the different seasons and considered future climate forecasts generated by 27 different climate models. They offer analogs for two emissions scenarios -- one that assumes high current emissions continue and one that assumes emissions peak mid-century and then decline. Try the map here.
More data, please
Researchers at Carnegie Mellon University recently published 150 years of climate history for more than 100 U.S. cities, constructed from daily measurements of temperature and precipitation. Using National Weather Service databases from the National Oceanic and Atmospheric Administration (NOAA), they combined data across different time periods and closely-located weather stations to create a composite climate history for each location. Their resultsare available for download and open use.
Citizen data scientist
Data scientist Max Miller took climate change analysis into his own hands. His interactive dashboard, Is Climate Change a Big Deal? ,uses NOAA data to show how much temperatures have changed in nearly 100 U.S. cities since 1950. Users can select a city and a metric to see average maximum and average minimum temperatures year by year and averages of all daily maximums and minimums. Miller built the dashboard in Python, using the Plotly graphing tool and explains how he did it here.
Counting the forests and the trees
Despite the fact that trees sequester about a third of the greenhouse gas emissions humans emit every year, many communities do not include forests or trees in their GHG inventories due to a lack of guidance.
Under new protocolfrom Local Governments for Sustainability USA and an upgraded tool, communities can develop inventories that take into account the effect trees have on GHG.
ClearPathis a free cloud-based energy and emissions management software tool that now has new calculators that will allow communities to develop GHG inventories that take trees and forests into consideration. The protocol was piloted with Montgomery County, Md., Los Angeles County, Calif., and Whatcom County, Wash.
Sea-level rise
In Maine, the cities of South Portland and Portland are planning to reduce greenhouse gas emissions 80% by 2050 and preparing for rising sea levels and extreme weather events.
Eileen Johnson, a lecturer and program manager for environmental studies at Bowdoin College, worked with The Nature Conservancy to develop the Maine Coastal Risk Explorer, an interactive tool that allows town officials to see which streets will be affected by flooding. In addition to displaying impacted roads at varying sea-rise levels, the digital tool ranks the social vulnerability of residents based on 17 socioeconomic and demographic characteristics, including socioeconomic status, ages and disabilities, housing and transportation access.
Similar tools have been developed for the Tidewater areaof Virginia and Miami. In June, NOAA launchedthe Coastal Inundation Dashboard, which provides real-time and historic coastal flooding information at most of NOAA's coastal water level stations.
The best of the rest
U.S. Climate Resilience Toolkithas more than 200 digital tools from all across the U.S. federal government to help state and local organizations build climate resilience.
Read the article at GCN.